Breathing Becomes Difficult in Delhi After Diwali: The True Pollution Statistics and the Controversy Over CPCB Sensor Limits
Following Diwali, PM2.5 levels in Delhi surged up to 71 percent due to firecrackers. Scientific questions have been raised regarding CPCB's data gaps and its 1,000 µg/m³ measurement limit.

Following the Diwali festival, air quality in the national capital Delhi and its surrounding areas has reached critical levels. According to a report by the source-apportionment model of the Indian Institute of Tropical Meteorology (IITM), the share of firecrackers in Delhi's air pollution was recorded at 71.1 percent on Monday, November 9, 2026, the day immediately following Diwali. In the statistical model, this share shows significant variability and uncertainty with a standard deviation of 104.1 percent.
The very next day, on Tuesday, November 10, 2026, this share dropped to 29.8 percent. Nevertheless, toxic smoke from firecrackers remained the single largest source of pollution in the atmosphere. At 4 PM on November 10, Delhi's average Air Quality Index (AQI) was recorded at 299, which falls under the 'poor' category. However, by 11 AM on Wednesday, November 11, 2026, the average AQI rose to 308, entering the 'very poor' category.
ટકા (%)

Firecrackers and Scientific Source Apportionment
According to the scientific analysis by IITM, vehicular emissions accounted for 6.9 percent of pollution on the first day after Diwali. Secondary inorganic aerosols accounted for 5 percent, secondary organic aerosols 4.5 percent, biofuel or undefined burning of wood and coal 4.45 percent, while mineral dust and ash, and mixed combustion were each recorded at 2.5 percent. Burning wood caused 1.3 percent of pollution, and burning garbage or plastic-rubber caused 1.1 percent. Coal combustion added 0.5 percent and industrial emissions added 0.2 percent to the pollution.
However, the picture changed on Tuesday, November 10. When the share of firecrackers dropped to 29.8 percent, secondary organic aerosols became the second-largest pollutant source at 17.5 percent. Vehicular emissions and secondary inorganic aerosols both accounted for an 11.7 percent share. Additionally, the share of wood burning increased to 10.7 percent and garbage burning to 7.7 percent. Mixed combustion was recorded at 5.1 percent and mineral dust at 1.5 percent.
| Source of Pollution | Share (%) |
|---|---|
| Firecrackers | 29.8% |
| Secondary Organic Aerosols | 17.5% |
| Vehicles | 11.7% |
| Secondary Inorganic Aerosols | 11.7% |
| Wood burning | 10.7% |
| Waste burning | 7.7% |
Delhi's Air Was Toxic Even Before Diwali: CSE Report
According to a report released by the Center for Science and Environment (CSE) on November 11, 2026, even before Diwali firecrackers and stubble burning (stubble stubble-burning), Delhi's air had become the most toxic in the last three years. In the week leading up to Diwali, the average concentration of Particulate Matter (PM2.5)—fine particles smaller than 2.5 micrometers suspended in the air—was recorded at 236 micrograms per cubic meter (µg/m³). This level was 97 percent higher than the corresponding period in 2025 and 32 percent higher than in 2024.
According to the CSE analysis, vehicles account for 52 percent of local pollution sources. In addition, pollution coming from other districts of the National Capital Region (NCR) surrounding Delhi contributes 54.43 percent to Delhi's total PM2.5. Nitrogen dioxide (NO2) gas emitted due to traffic in the evening remains at high levels until late at night, which shows that even emergency measures have failed to reduce traffic jams.
Sensor limitations and allegations of data disappearing on CPCB
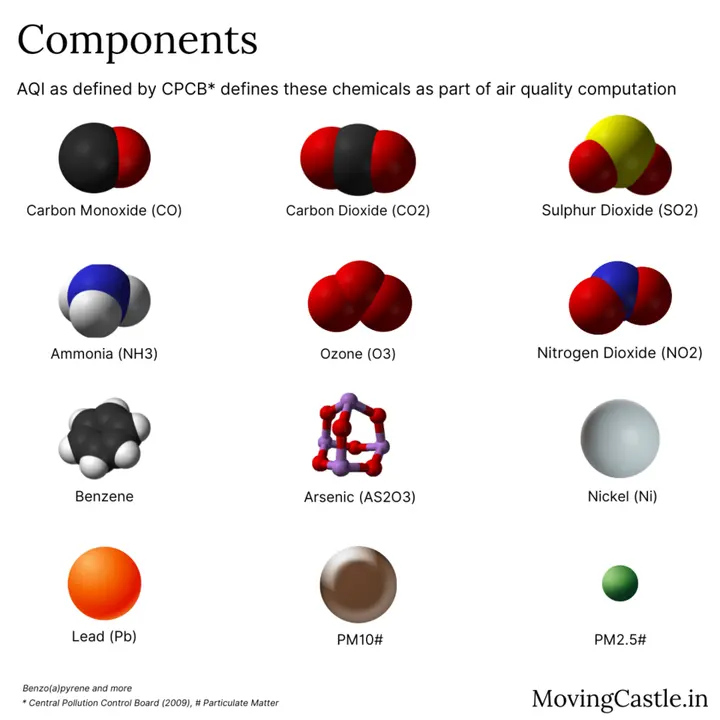
The Central Pollution Control Board (CPCB) monitors 8 major pollutants (PM2.5, PM10, CO, NO2, SO2, NH3, ozone, and lead) under the National Air Quality Index (NAQI). On the night of Diwali at 1 AM, the PM2.5 level at Anand Vihar station reached 764 µg/m³. For the next 3 hours, PM2.5 data, and from 11 PM for 5 hours, PM10 data disappeared from the portal. Environmentalists alleged that this is not possible without human intervention and that it makes air quality look improved on paper.
In response to these criticisms, the CPCB clarified that in 2015 when the NAQI system was launched, PM analyzers were calibrated only for a range of 0 to 1,000 µg/m³. When pollution levels exceed 1,000 µg/m³ during intense firecracker burning events, the automated system discards those figures as "out of range". The board said that once the level exceeds 500 AQI, the health risk remains in the 'Severe' category, so showing a figure above 500 is not necessary. However, officials have acknowledged that consideration is now underway to increase the cap so that peak levels above 1,000 µg/m³ can also be measured.
AQI calculation and India's polluted cities
According to CPCB's 2015 methodology, data for at least 3 pollutants is required to calculate AQI, in which either PM2.5 or PM10 is mandatory. There are a total of 59 air quality monitoring stations in Delhi, out of which 46 stations are operated by the Delhi Pollution Control Committee (DPCC). DPCC does not calculate AQI itself but sends its data to CPCB. On the night of Diwali, DPCC sensors recorded levels exceeding 1,000 µg/m³.

At 11:00 AM on November 11, 2026, Delhi's average AQI was 308, placing it at the bottom of the 10 most polluted cities in the country. Sirsa in Haryana recorded an AQI of 395, while the figure reached 404 at Delhi's Chhawla station. The AQI in Hisar, Bhiwani, Panchgaon, Baghpat, Ballabhgarh, Karnal, Anpara, and Bulandshahr remained between 310 and 393. Like the United States Environmental Protection Agency (US EPA) and China, India also releases its official AQI based solely on 24-hour average data.